Consider you are fitting a linear regression on the given dataset, and draw the scatter plot of residuals vs predicted values. However, you might feel confused when you get the following interesting plots.
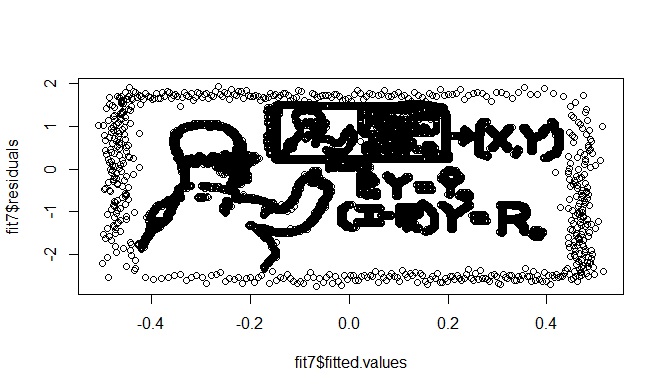
How to make a plot like this?? The key idea is just shown in the above picture: the projection matrix in the regression model.
Assume we want to fit a linear model: \(y= X\beta + \epsilon\).